The way I was taught the hydrogen atom was very confusing, and full of dry formulae that didn't mean much at the time. The visuals I saw of the various chemistry-convention orbitals were also confusing, I saw blobs and lobes but no one explained to me what they meant. I recently revisited the topic, looking at the Born-Oppenheimer approximation applied to the humble single-electron atom as a prelude to more difficult methods (e.g. HF, DFT, ...etc), and I found myself with the same main gripe: I can only nod so much to formulas on screen without seeing anything. Equipped with the superior expertise of the senior undergrad that I now am, I went hunting for visuals.
To my total surprise, I didn't find enough to satisfy my curiosity. Visualizations exist, yes, but most of them were either simple cross-section renders, or solid-body renders calculated to contain a certain percentage of the probability of occupation. Neither satisfied my hunger for a more visceral understanding. The wavefunction is inherently a three dimensional volumetric object, reducing it down to a cross-section or 3D surface lost a whole dimension of detail. I felt like so much intricate structure was hiding behind those simplifications. Plus I was drooling at the idea of seeing a hydrogen atom fog. Despite my disbelief that such a fundamental cornerstone of quantum mechanics was underexplored, I decided to make my own visualizations.
This led me through a multi-week journey in computer graphics and visualization techniques. Recent advances in LLM technologies and especially agentic coding made this quite possible. All I had to do was get a solid enough understanding of the rendering techniques I would want to use and their parametrizations, and the rest was hammering Claude Code until satisfactory results were obtained. This effort eventually culminated with the creation of this repository and the web tool published off of it. (Warning: Having a discrete GPU on your device is advised, the tool is genuinely heavy.). If you end up using the tool to create visuals, please cite me! I'm trying to get my name out there.
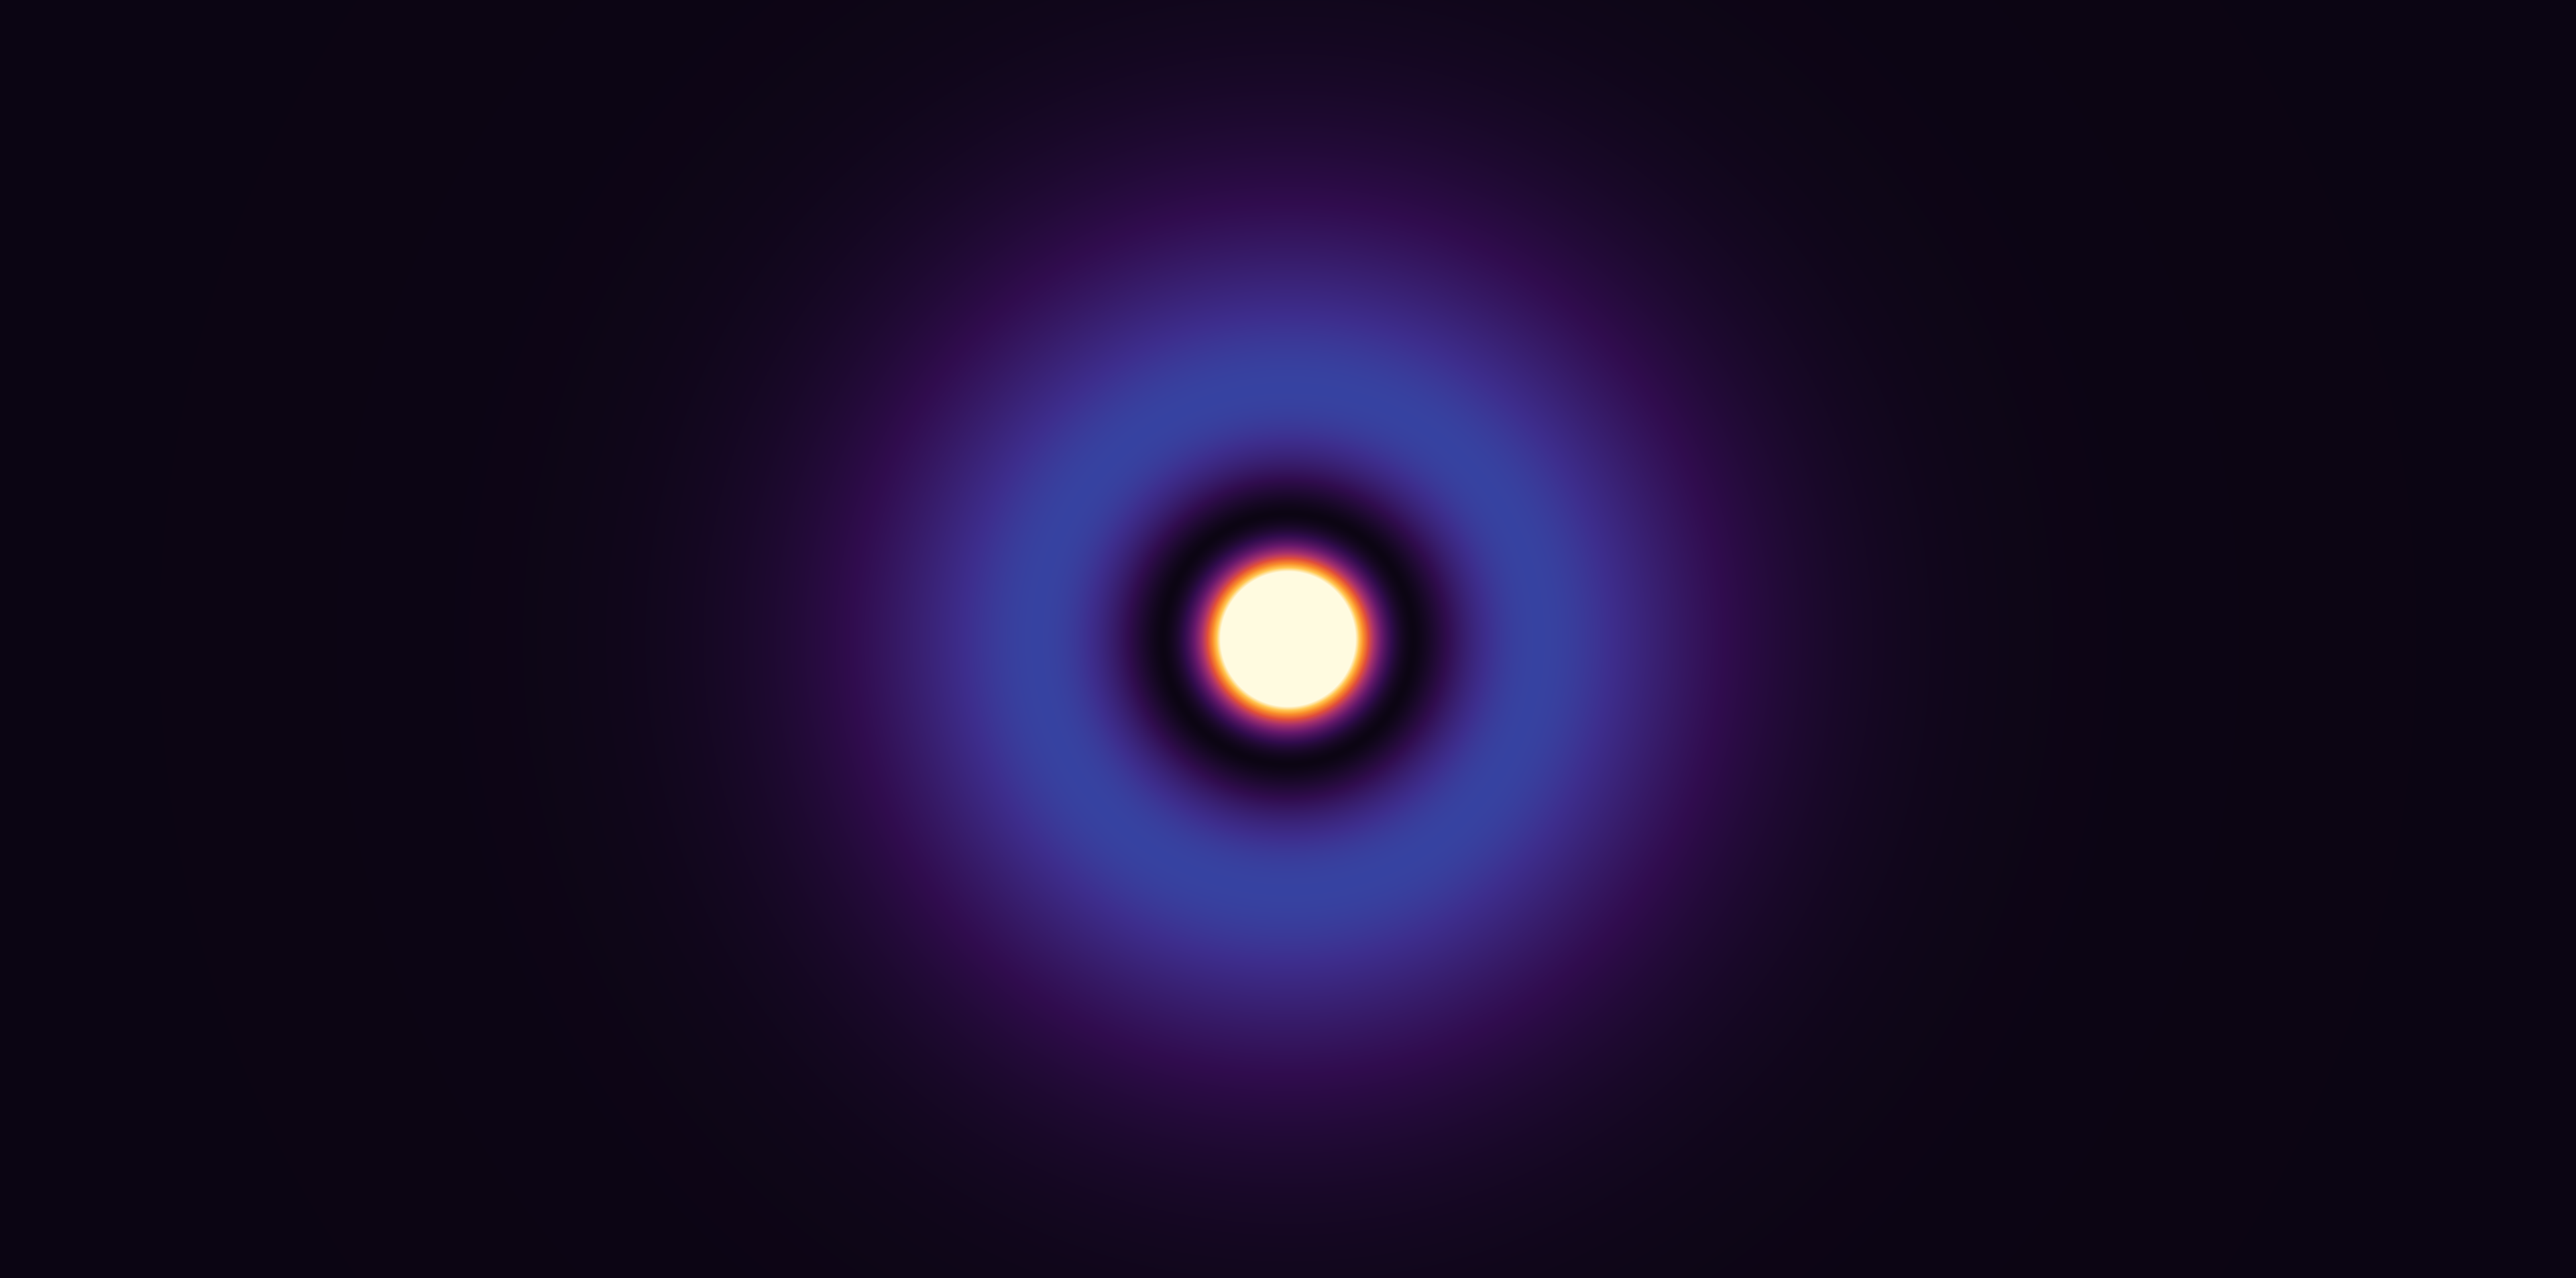
Now, I cannot claim to be an expert on the rendering side, or on the physics side. You can find plenty of authoritative sources on either subject, if that's what you want to explore. If you just want a brief, the README on the project's repository lists the rendering techniques, and you can refer to the thoroughly documented shader files for more details. What I can show you here however, is what resulted from me marrying the two. We can start light with the 2s orbital, with a cross-section at the origin. 1s is well-known to be a sphere, but 2s adds a new node, creating two concentric spherical regions with opposite signs, clearly illustrated through the picture below.
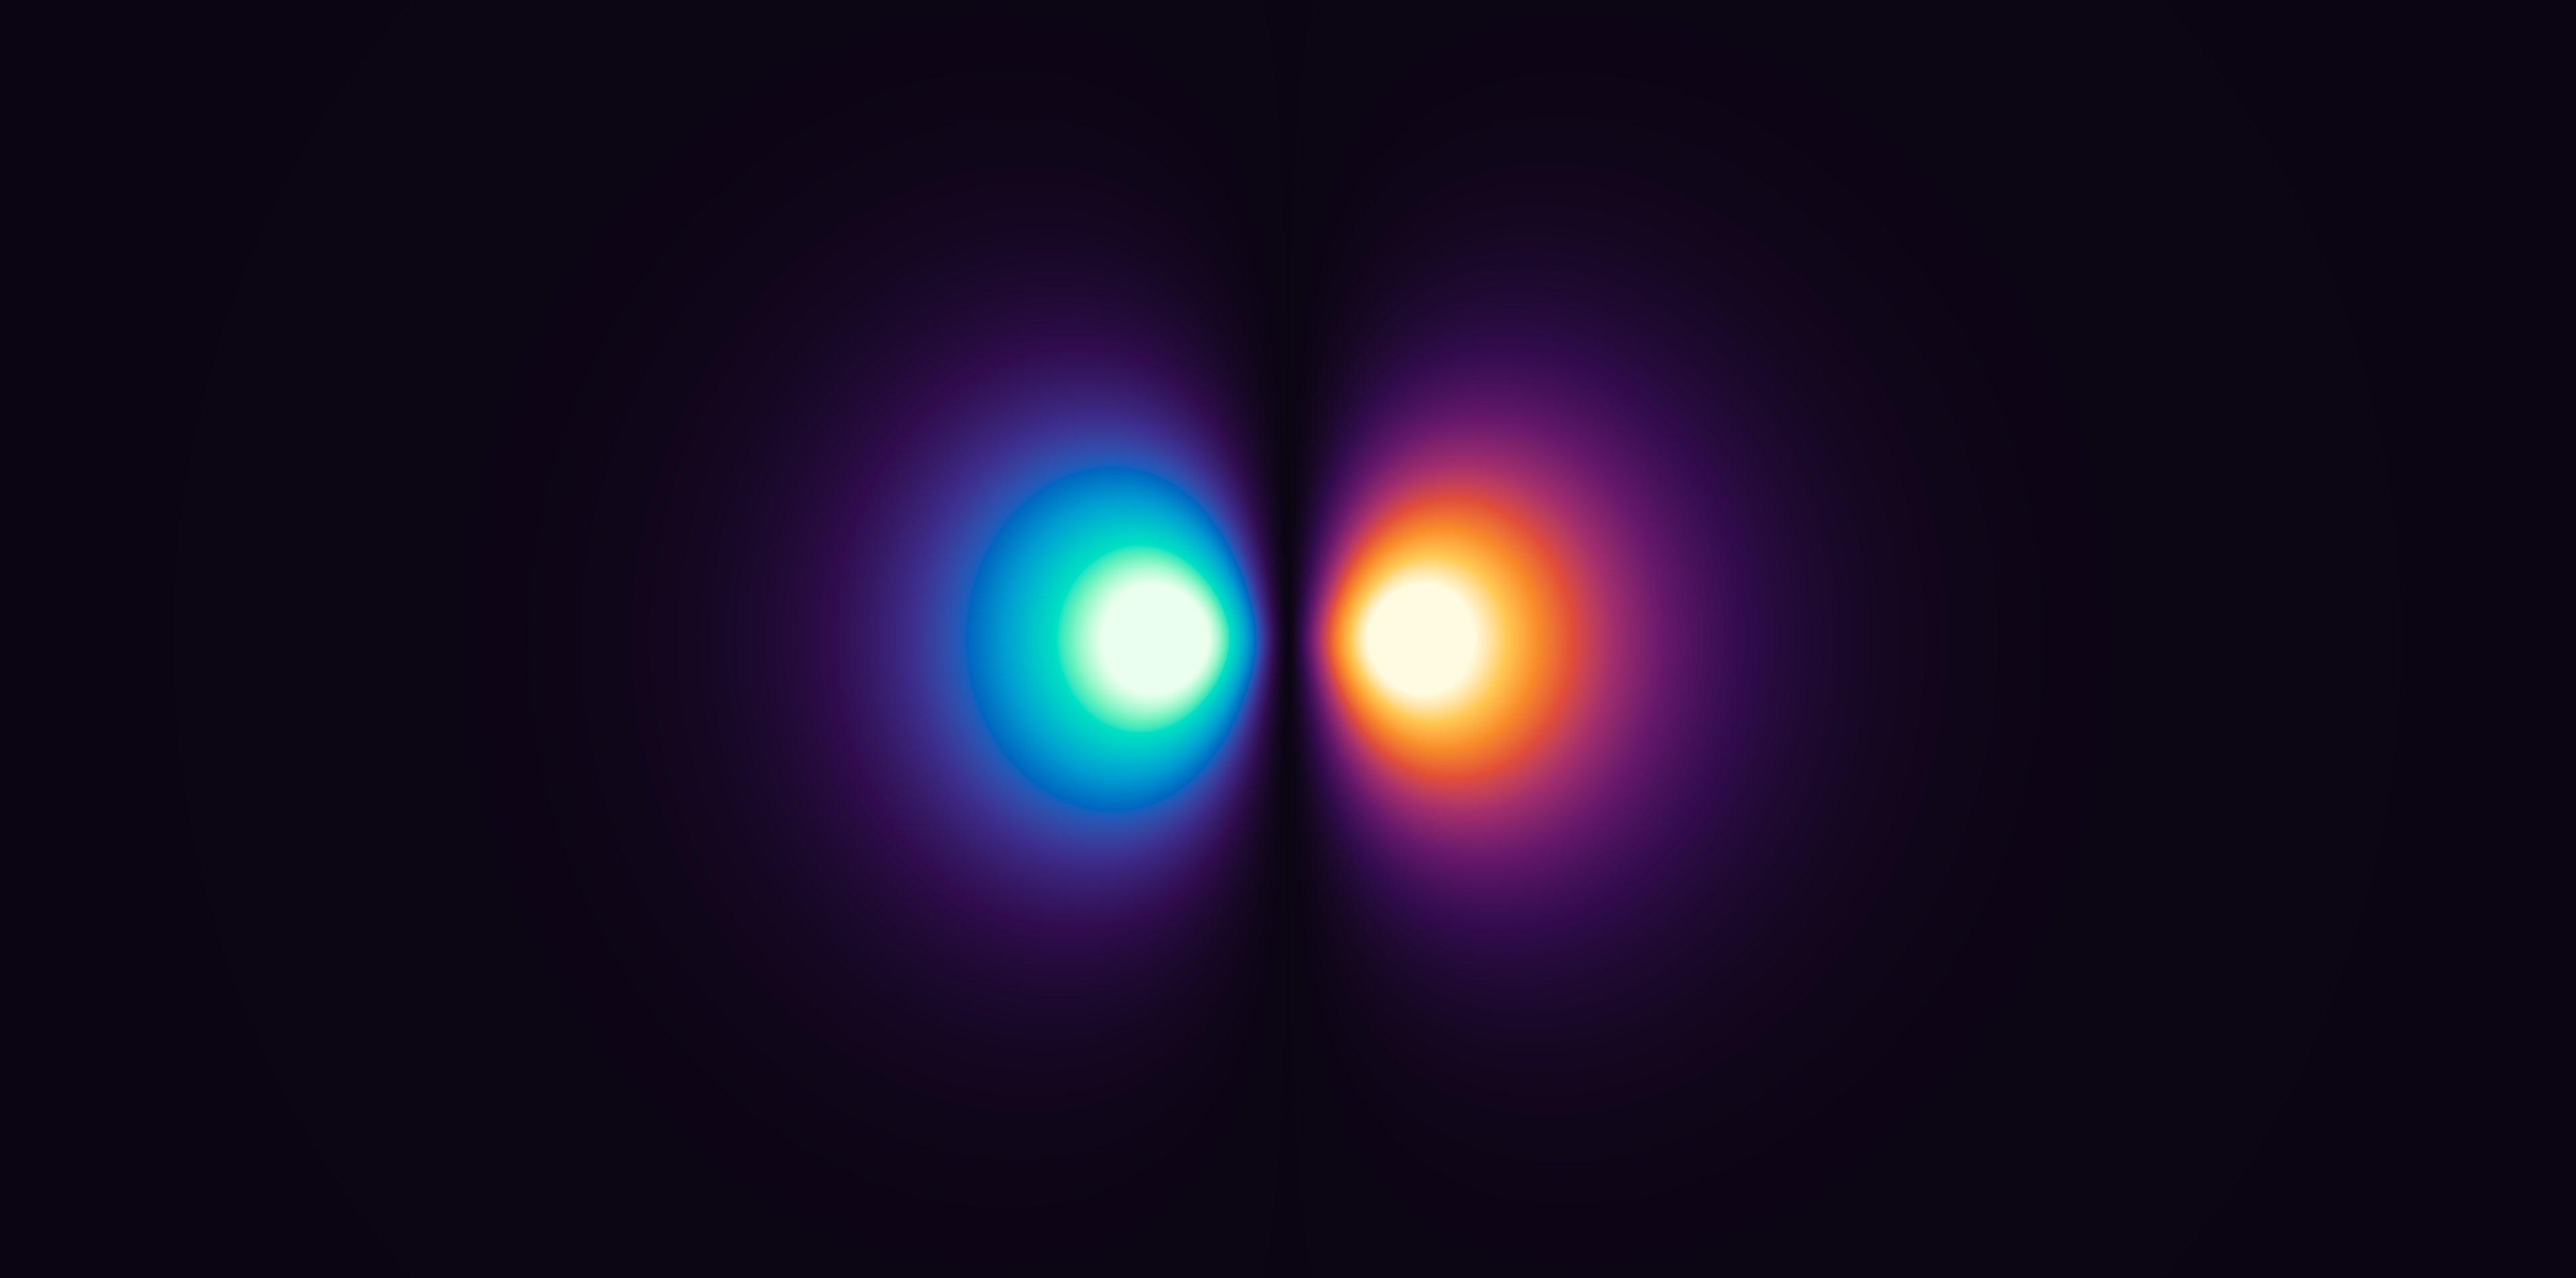
The 2p orbital cross-section shows the familiar double-lobe structure.
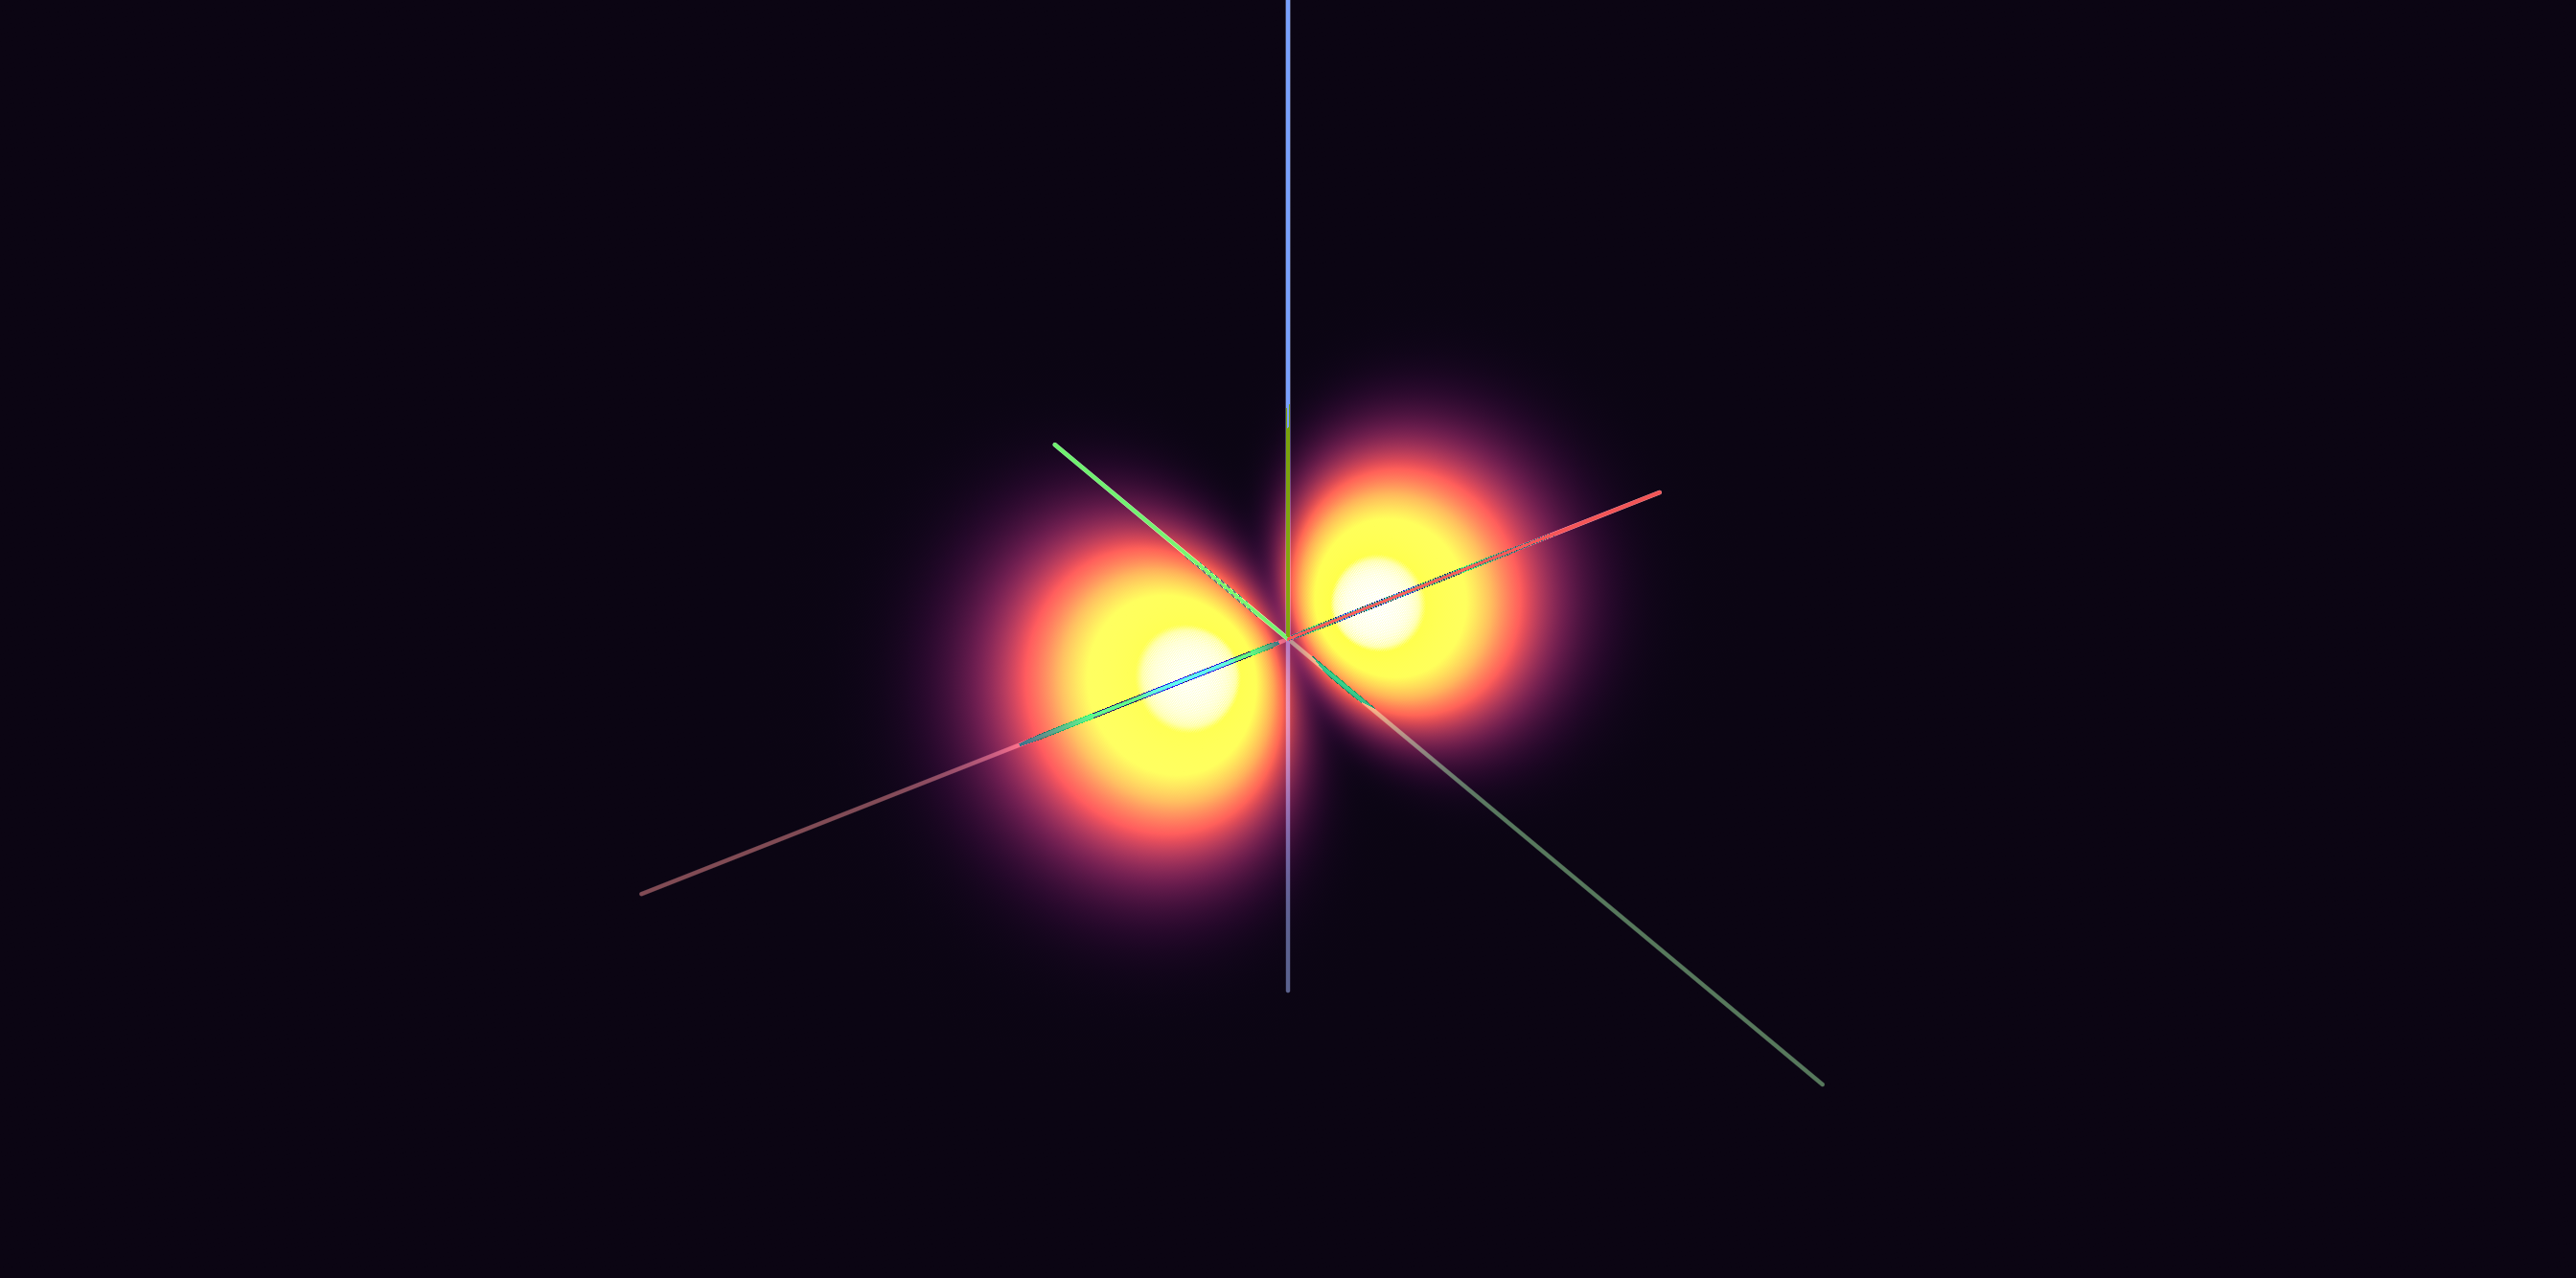
We can also see it in 3D:
I've adopted a black hole accretion disk like color palette for my default look. I think it goes quite nicely with volumetric techniques. When applicable, negative phase is colored blue.
The wavefunction becomes more and more complex (and honestly more and more beautiful!) with higher energy levels. Makes sense, after all that correlates to more nodes and thus more intricate structure.
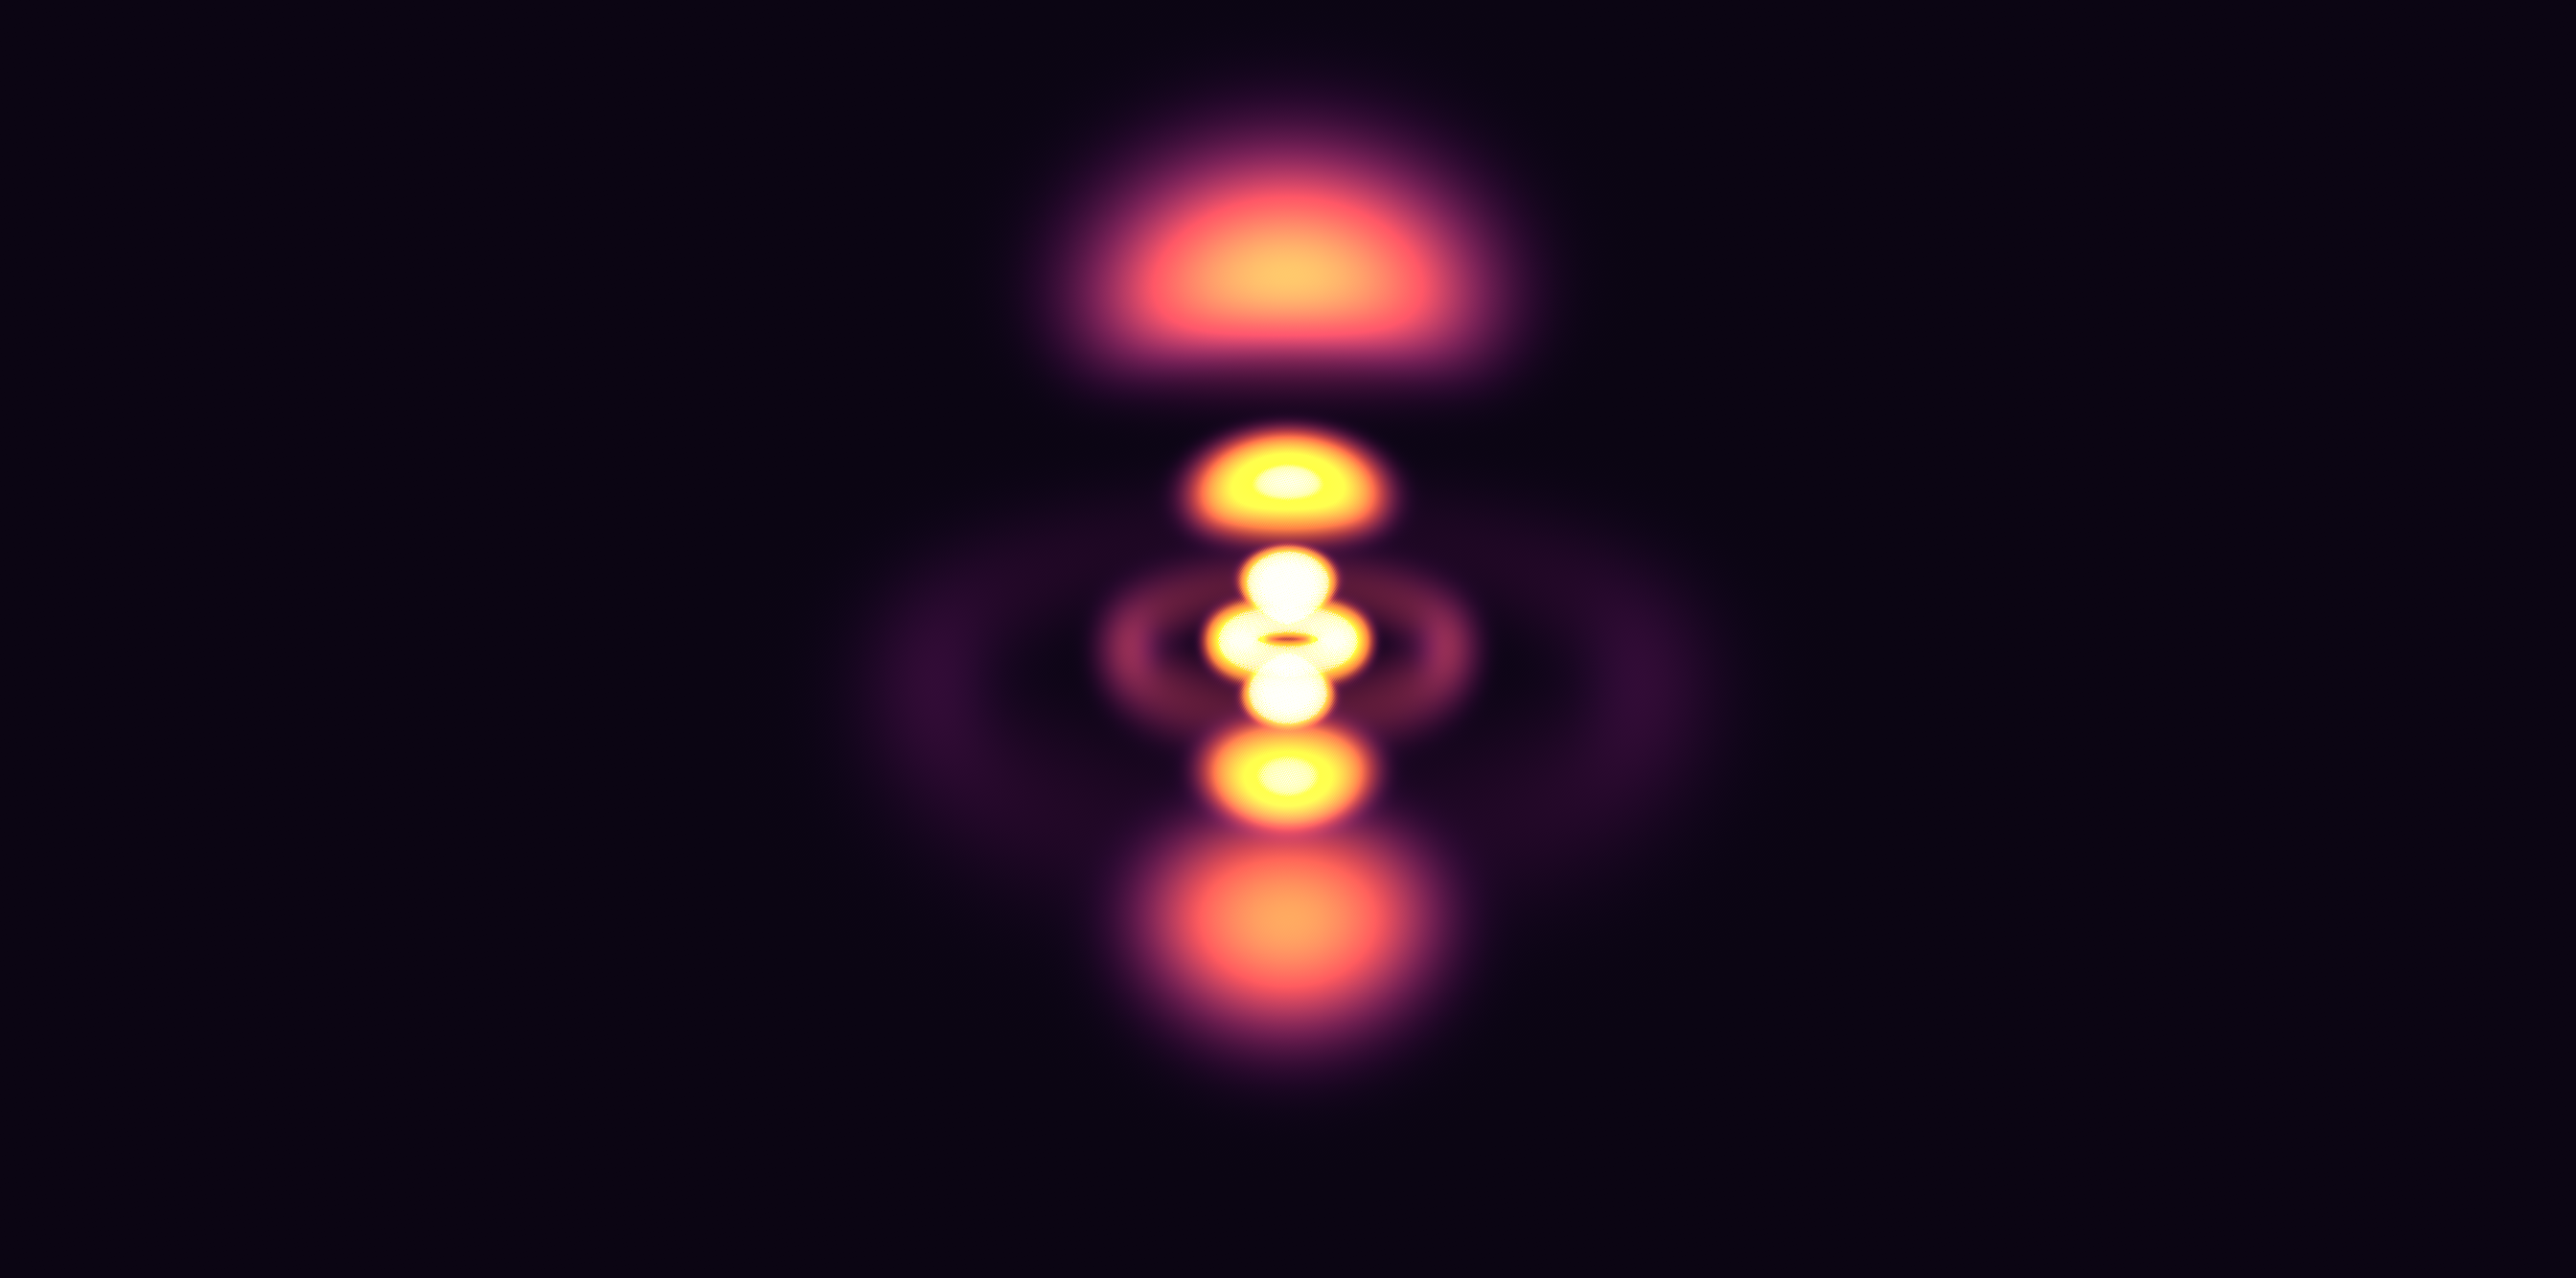
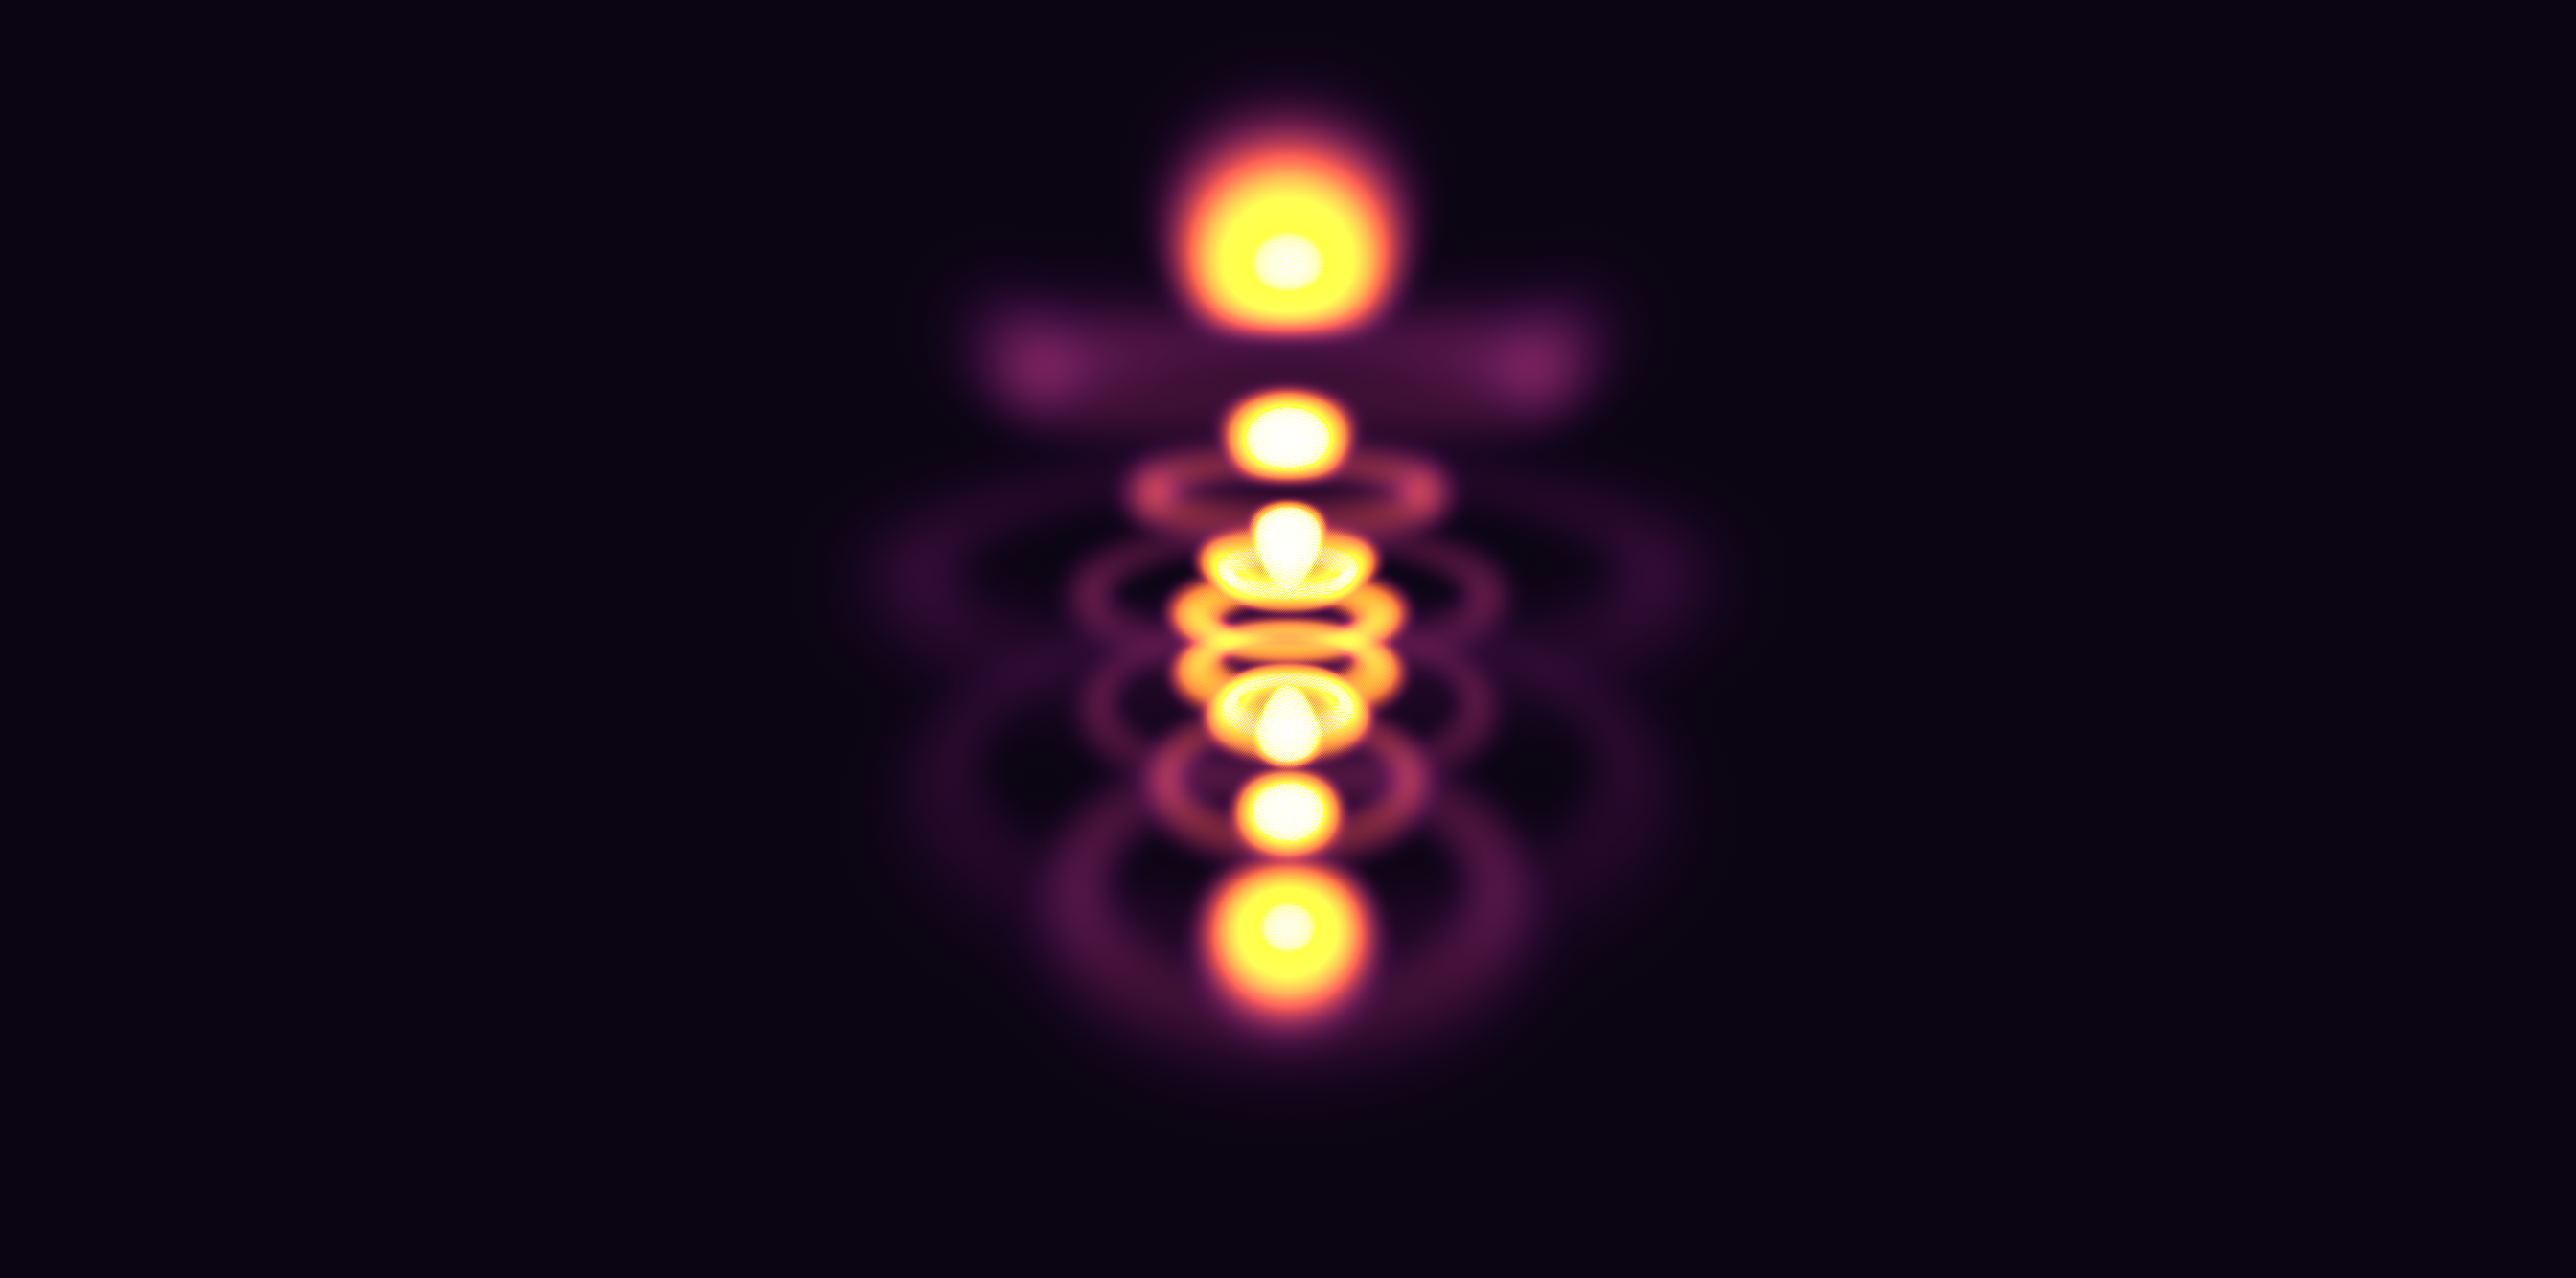
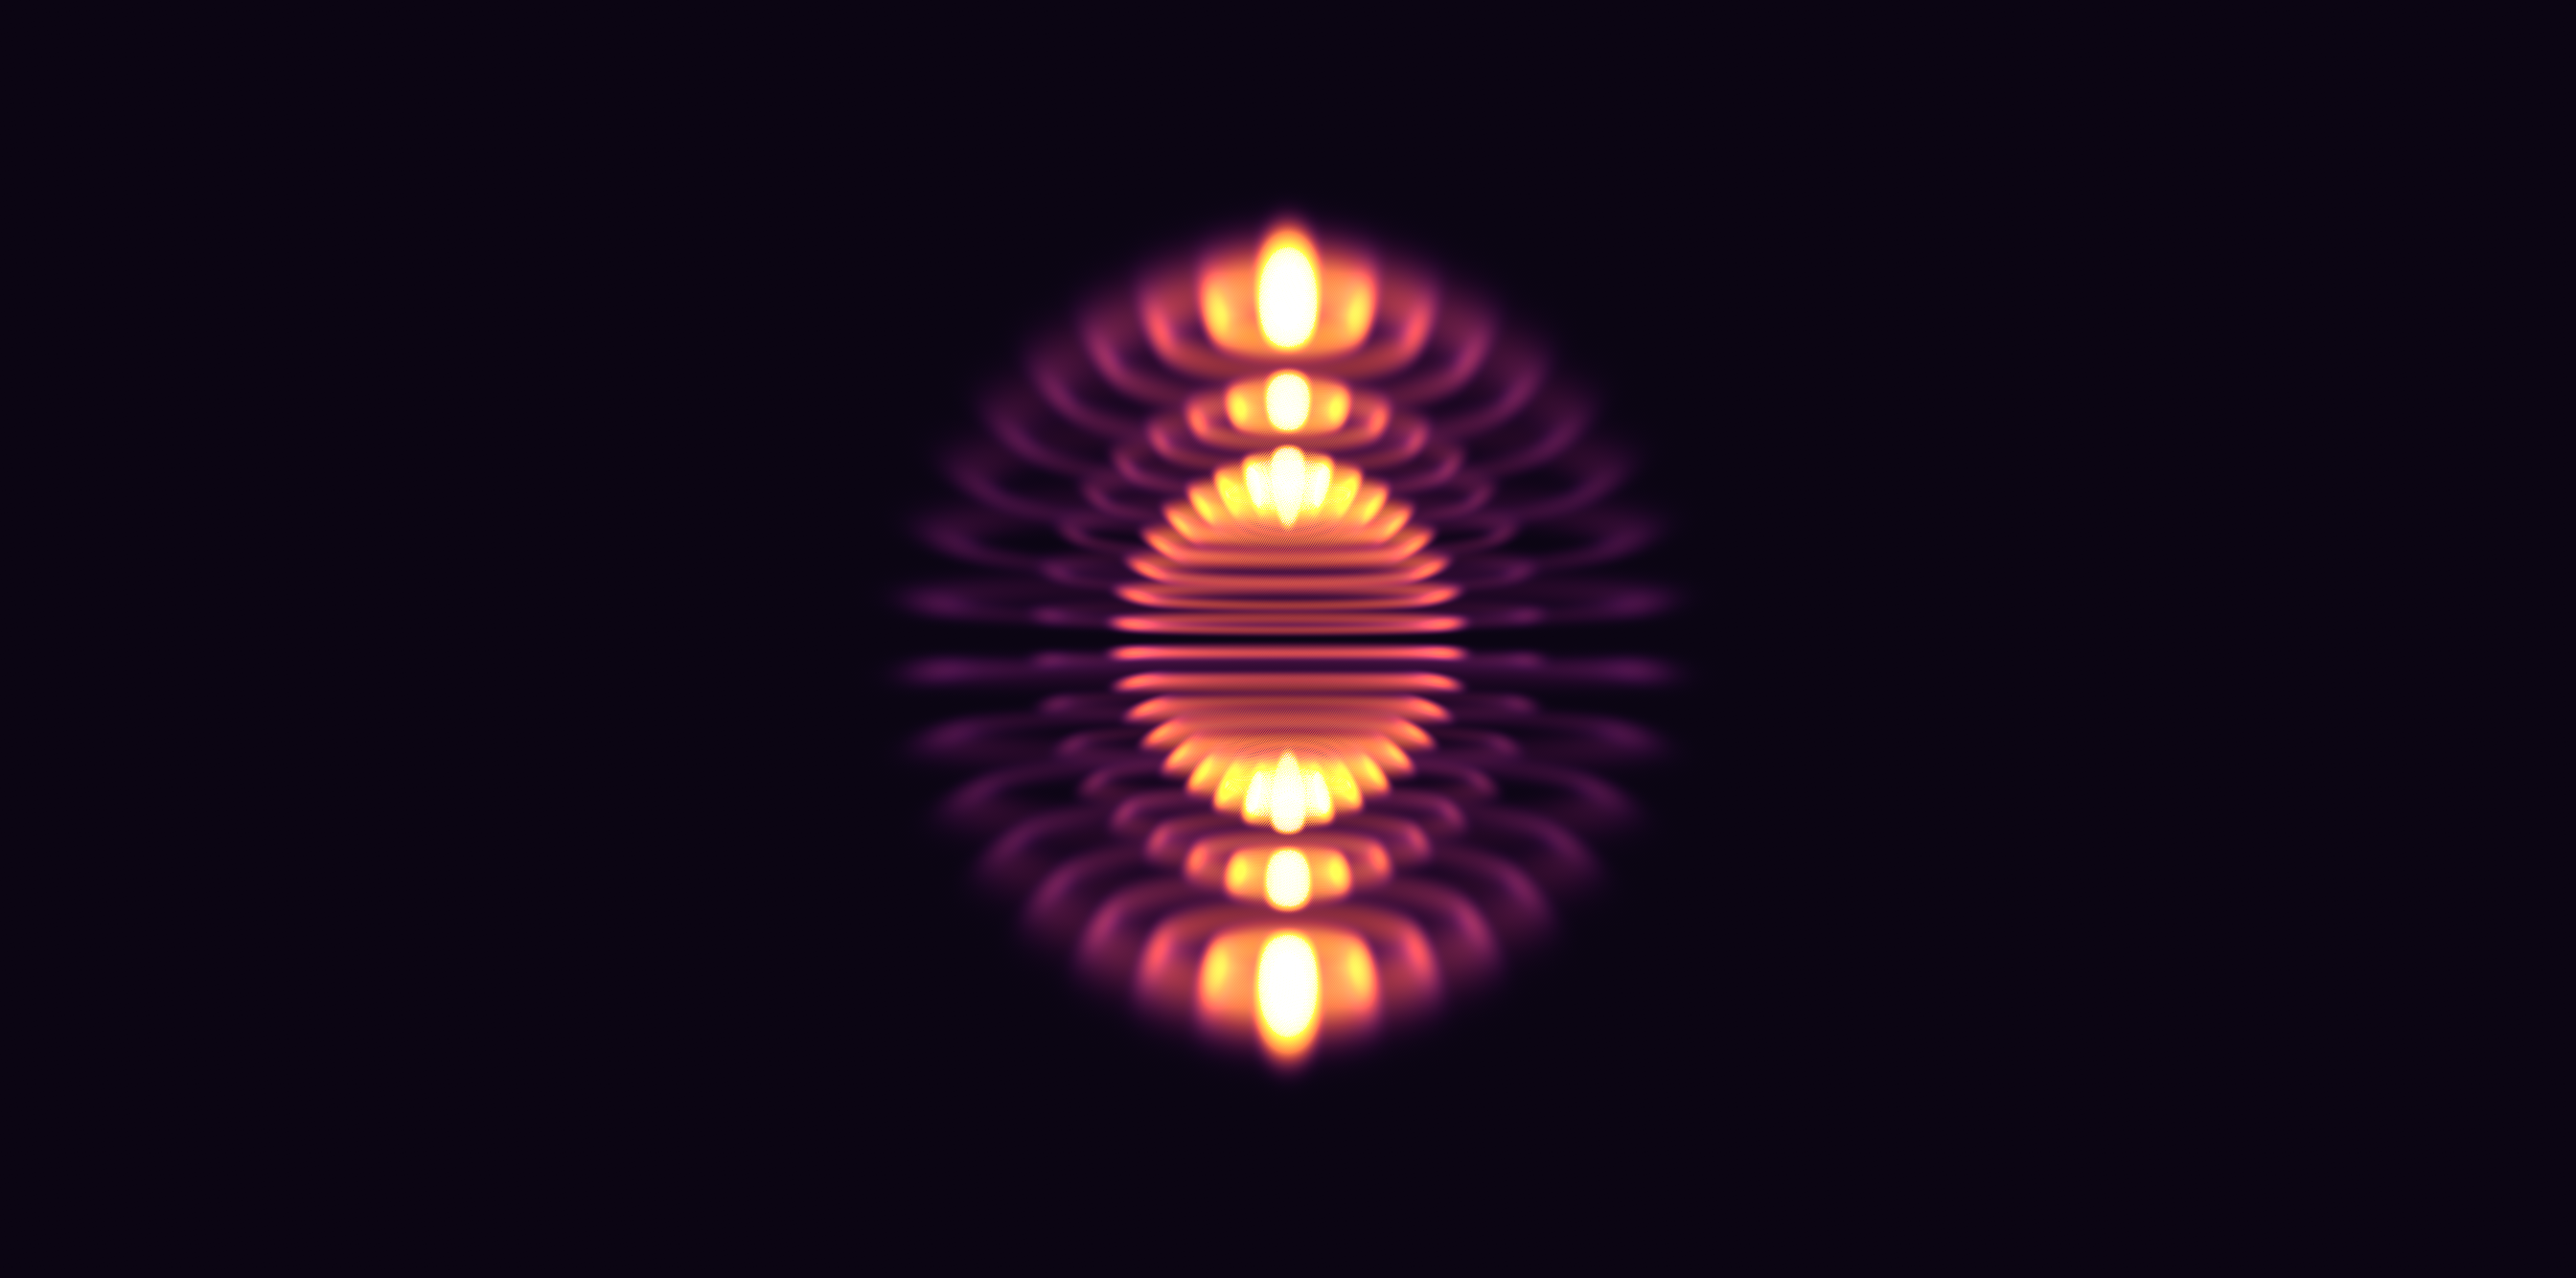
Oh, and if you're ever wondering what technique + n/l/m values were used for any one picture, you can just check its filename! (Except one or two whose original filenames I lost)
Looking at the nodal complexity is only dimension of the beauty of the wavefunction. Phase sign introduces another facet.
.png)
.png)
Why stop there? We can color each point by its complex argument, and get the full spectrum of phase.
.png)
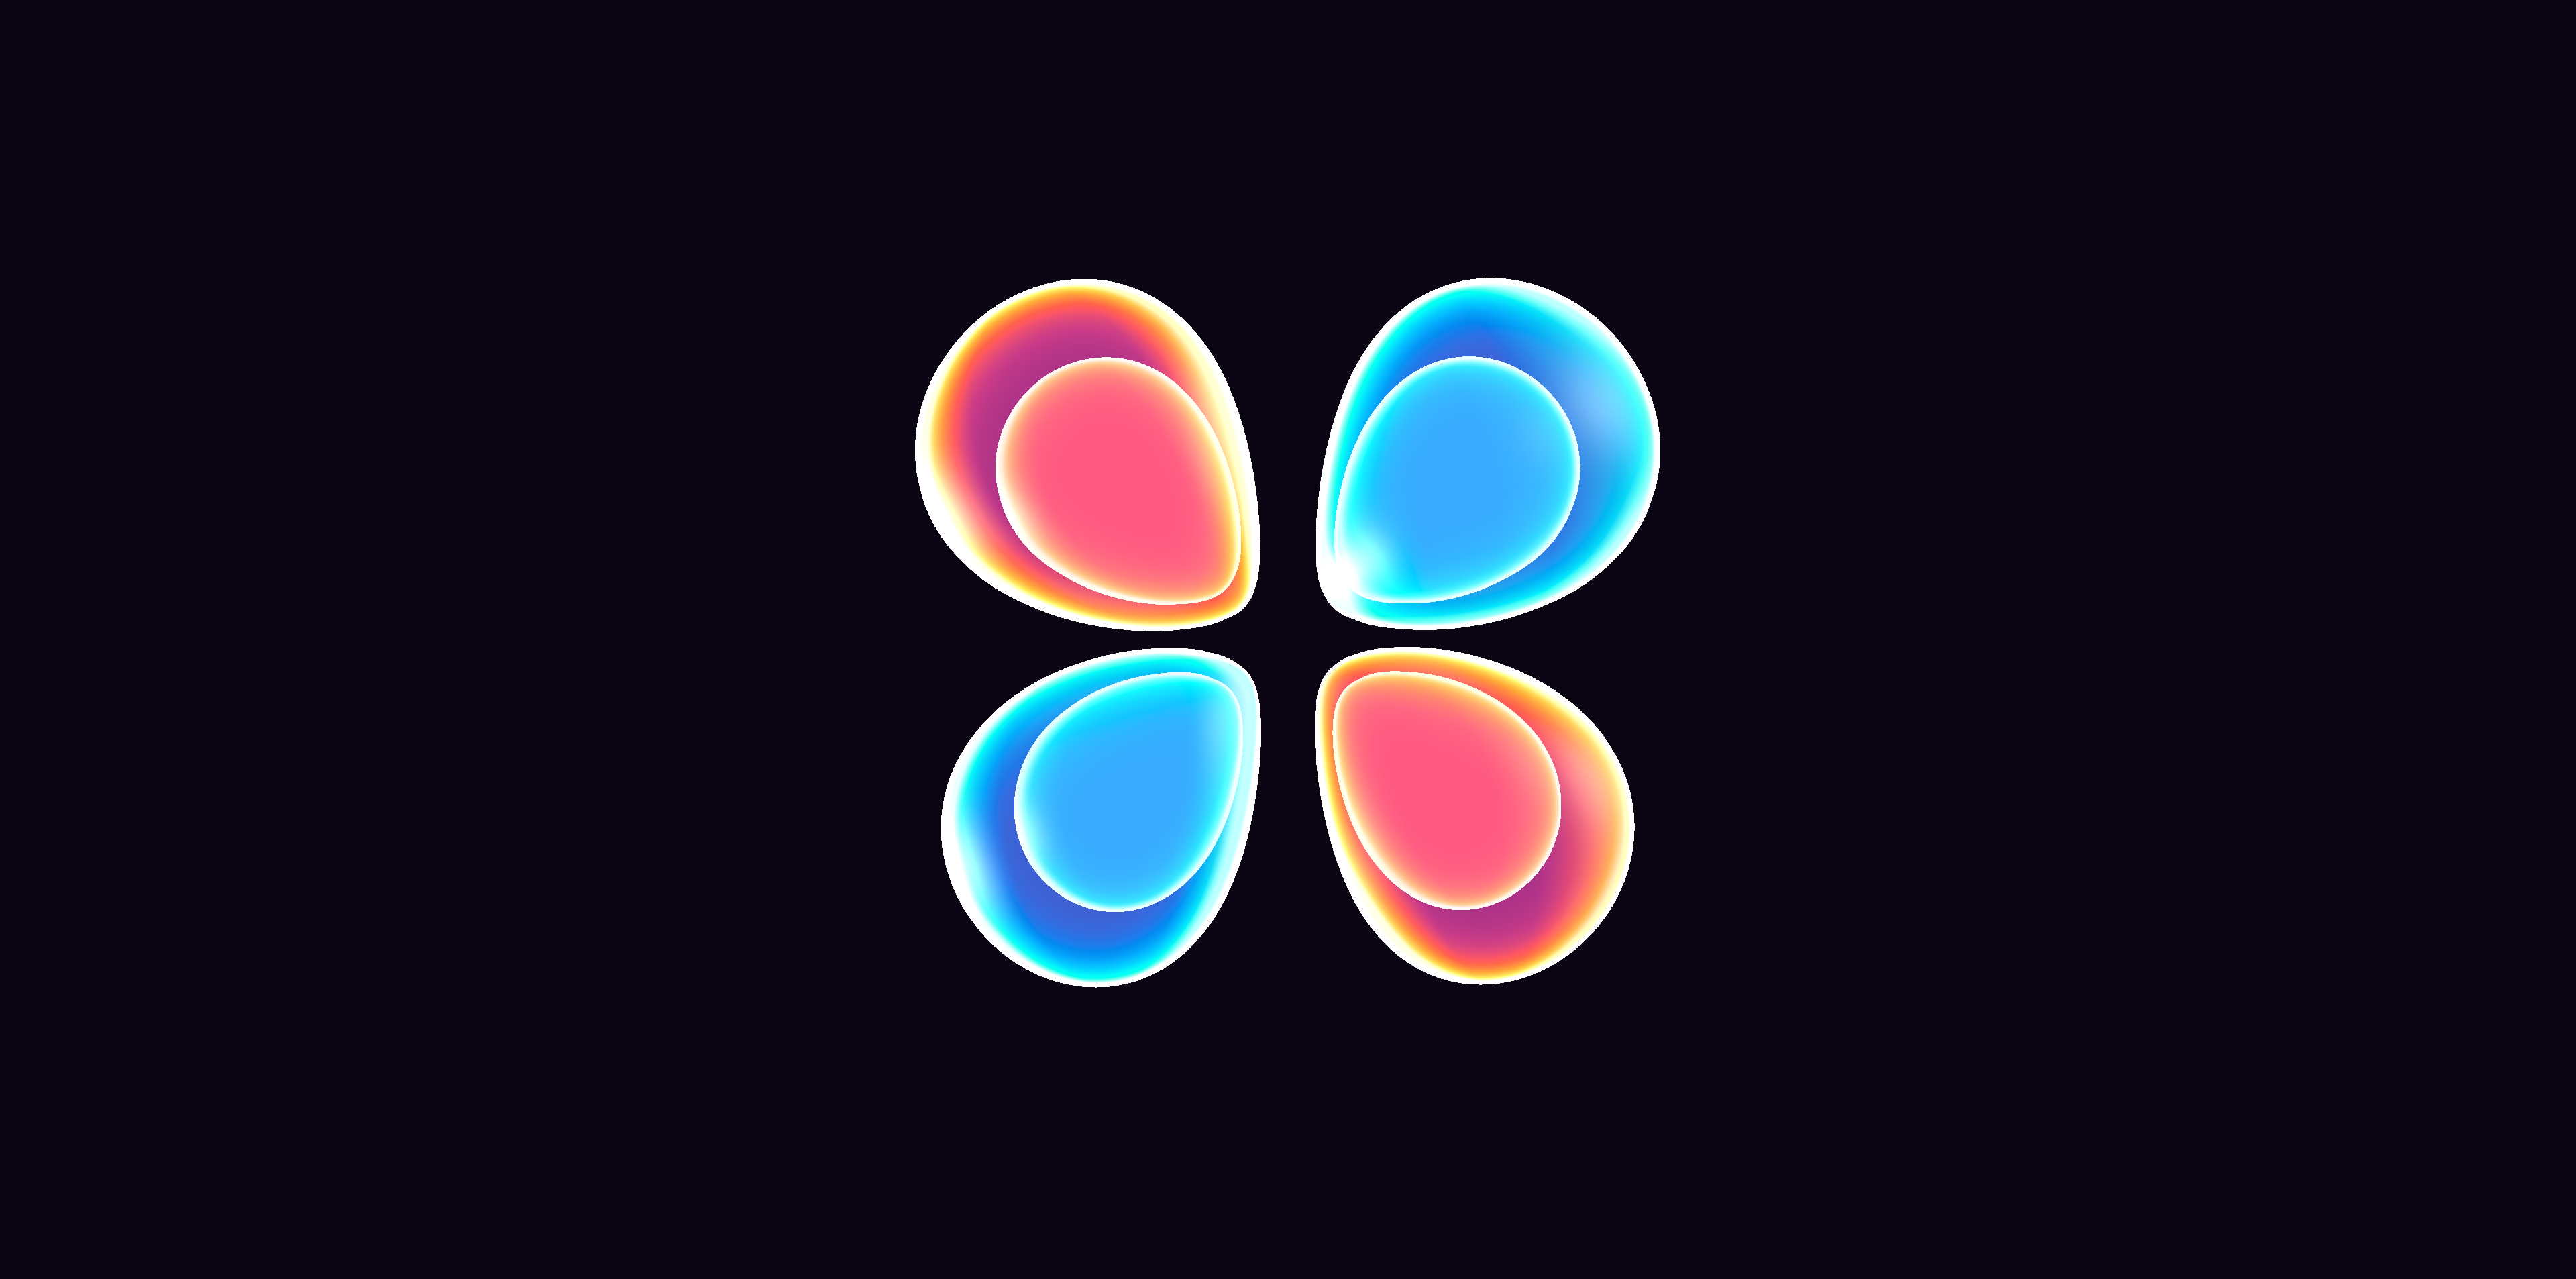
Isosurfaces (surfaces of equal probability density) are very common for visualizing wavefunctions. We can improve on that by making them see-through and drawing multiple instead of just one, to reveal structure at multiple layers.
The four-lobes pattern of the 3d orbital unfolds quite nicely.
And so does the six-lobes pattern of a 4f orbital (in the case of m=1)
.png)
The physics-convention eigenstates, although less familiar to most people, are equally interesting and beautiful.
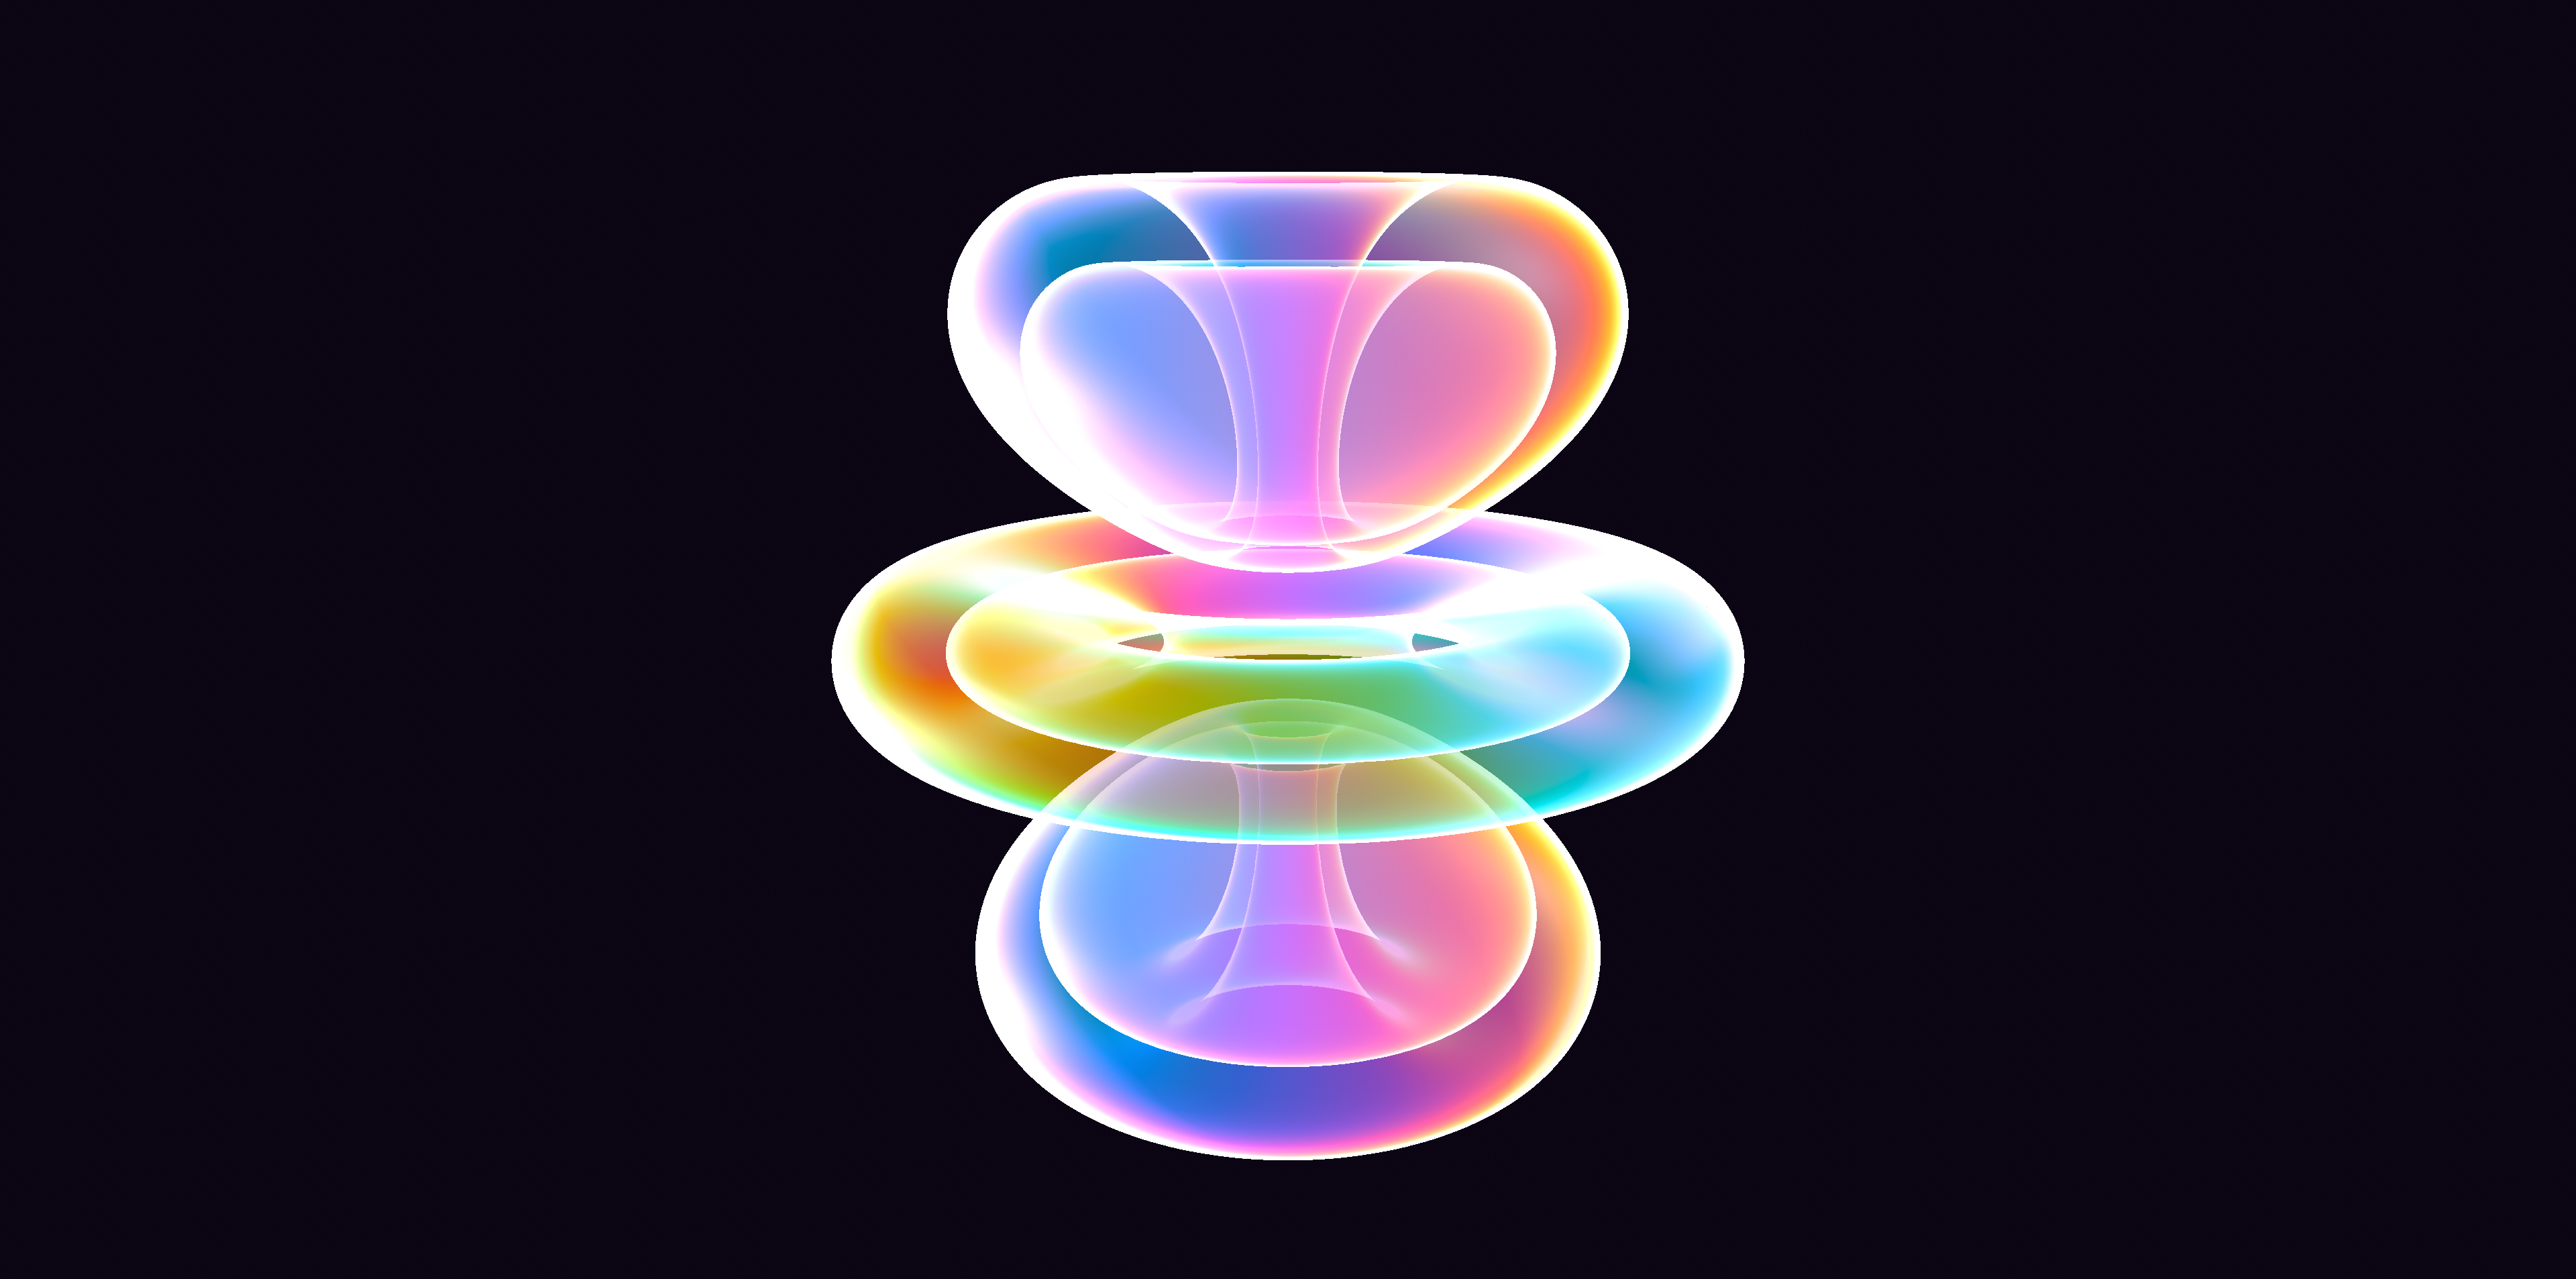
Superpositions are also possible with the tool! Although this is more of a desktop wallpaper.
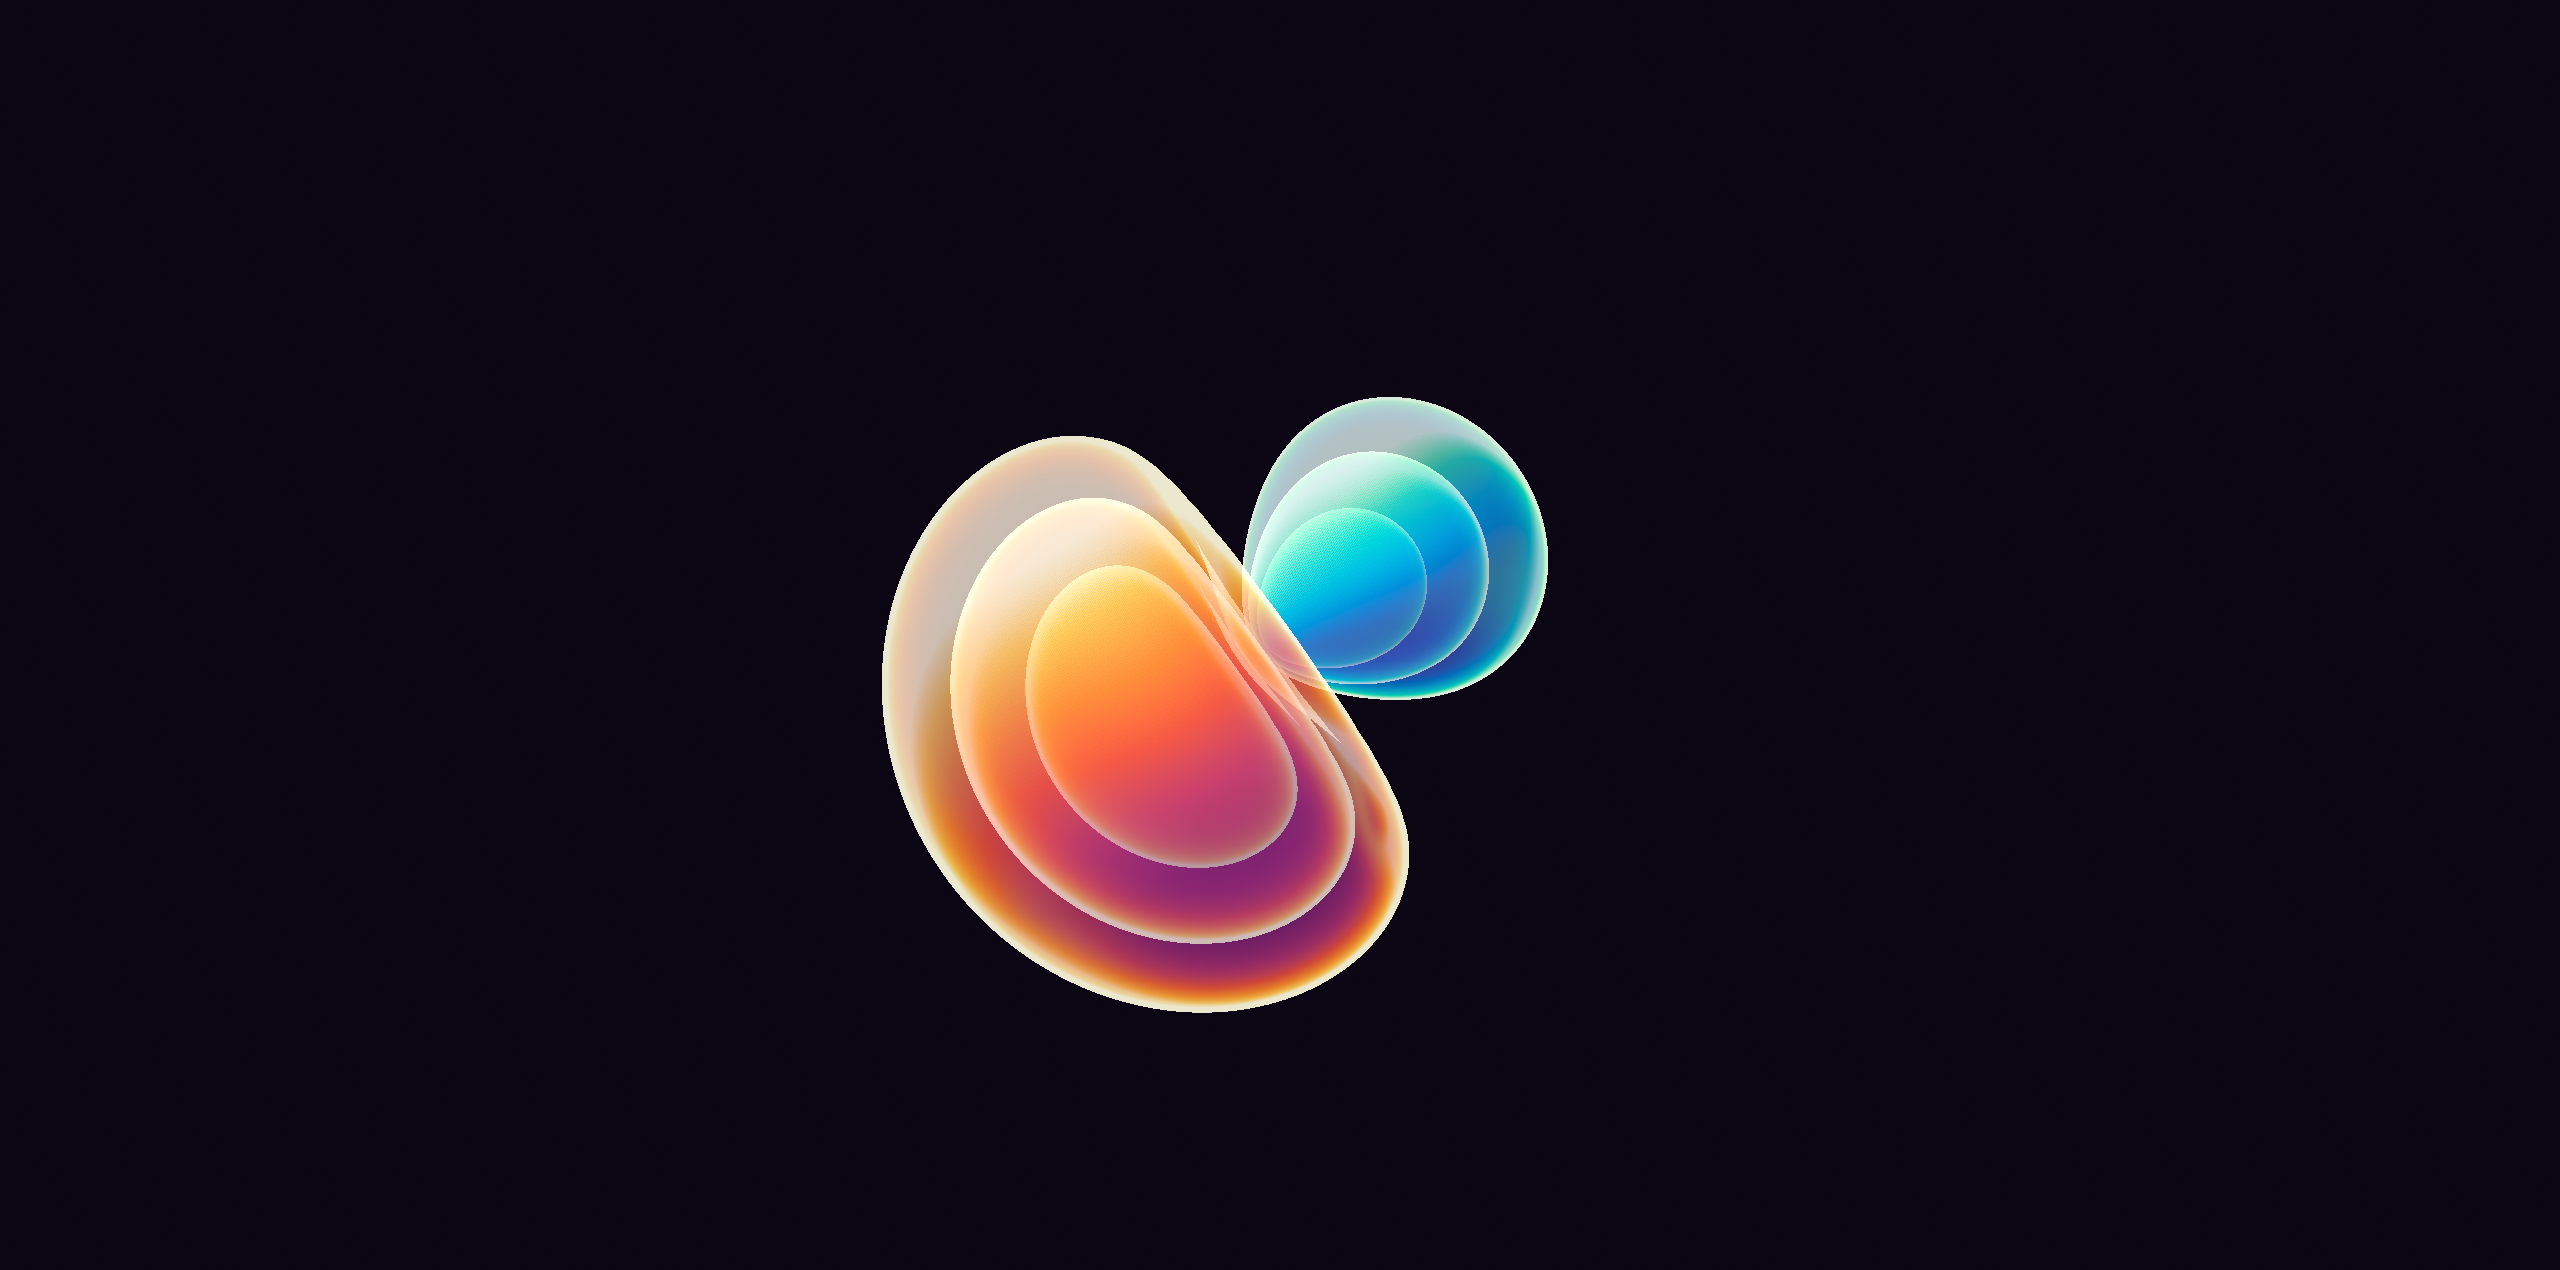
Speaking of desktop wallpapers, my friend made this cool art piece by superposing certain orbitals. I find it super cool.
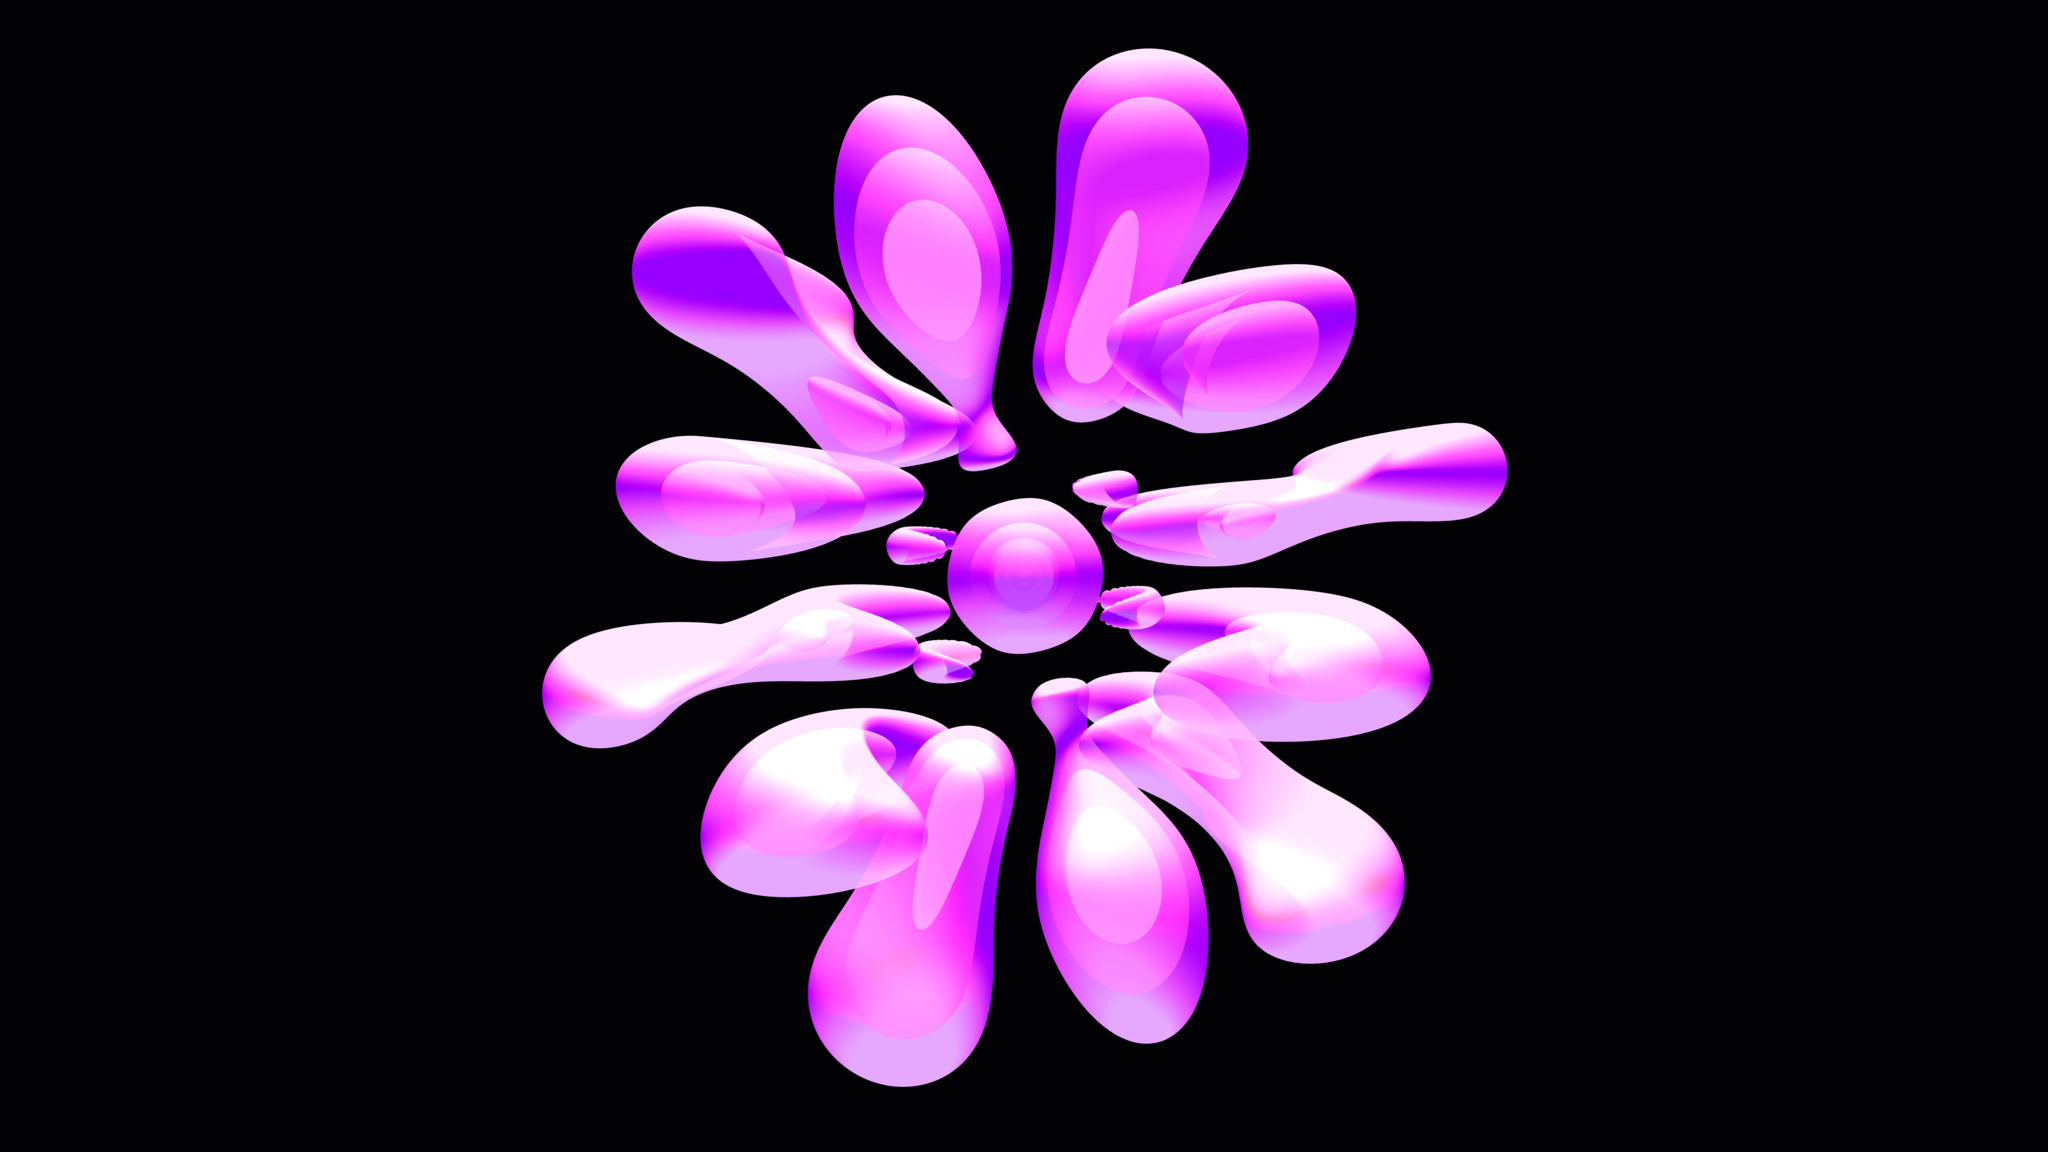
A more complete gallery of sample images can be found in this Drive folder.
I'm hoping to run this by a few people I know to get their review, then publish an exhaustive high-fidelity high-resolution gallery of visuals with multiple angles and techniques per state. That's ultimately what my contribution will be through this tool. Although the tool itself and the compact GLSL ES core are usable on their own.